

15. April 2025
/
/
Datensets
First Lessons from the Dezernat Zukunft Supply Side Monitor
8 min Lesezeit
In recent years, inflationary impulses came from supply shocks. The new Dezernat Zukunft Supply Side Monitor provides data on prices, production volumes, and limiting factors on a sectoral basis to track developments on the supply side. This knowledge will help combat inflation more efficiently while minimizing collateral damage.
Below, we present a first interpretation of the data going back to 2018. Going forward, the monitor will be updated monthly. We invite you to come back regularly to follow important macroeconomic developments as they unfold.
Aurora Li, Dr. Max Krahé
Last updated: 08.04.2025
Find the full Supply Side Monitor here.
For a better understanding of the Monitor, please consult the Methodological Guide.
Introduction
Inflation impacts people’s daily life – and elections. This puts pressure on governments and central banks to take effective countermeasures.
The classic countermeasure available to central banks is raising interest rates to reduce aggregate demand. This reduces inflation but can cause collateral damage – less investment, lower growth, and higher unemployment – especially if the original cause is a supply-side shock. In post-1980s central banking practice, “looking through” was therefore the standard response to supply shocks.
Recent commodity price shocks and supply chain disruptions, however, have shown that looking through supply-side inflation is not always possible. In a world of high uncertainty driven by climate change and geopolitical conflicts, this leaves central banks exposed to situations with only bad choices: look through a major supply-shock and risk an unanchoring of inflation expectations as well as political dislocations; or fight it with rate hikes and risk collateral damage to investment, growth, and jobs.
To widen the option set available to policy makers, a better understanding of supply side dynamics may be helpful. This is what the Dezernat Zukunft Supply Side Monitor offers. Our hope is that it can support timely and appropriate macroeconomic policy decisions by rendering the supply side more legible.
Below, we summarise recent trends that the monitor renders visible. Going forward, data will be updated monthly, and we will provide periodic commentary. We invite you to come back regularly to follow important macroeconomic developments as they unfold. You can send feedback or ideas for improvements to aurora.li[at]dezernatzukunft.org.
Recent trends
General limiting factors: from missing materials to missing orders
Concerning the limiting factors reported by companies, a shared pattern is visible across most industries: From early 2021 to mid- and late-2023, nearly all sectors experienced significant material shortages, indicating supply chain disruptions. Over the course of 2024, however, reports of a lack of orders as a limiting factor on production became dominant. This indicates that 2024 witnessed a shift: firms are again able to service existing demand and would welcome more of it.
Energy: price spikes and a shift from gas- to electricity imports
Since mid-2021, prices in the energy sector have followed a mostly uniform pattern. A notable set of price spikes occurred in the summer of 2022. In the electricity and gas sectors, prices peaked at approximately 400 percent above the base year (2021). Other energy sectors, such as refined oil and crude oil imports, also experienced price increases, though their peaks were significantly lower at around 200 percent of the base year.
Figure 1
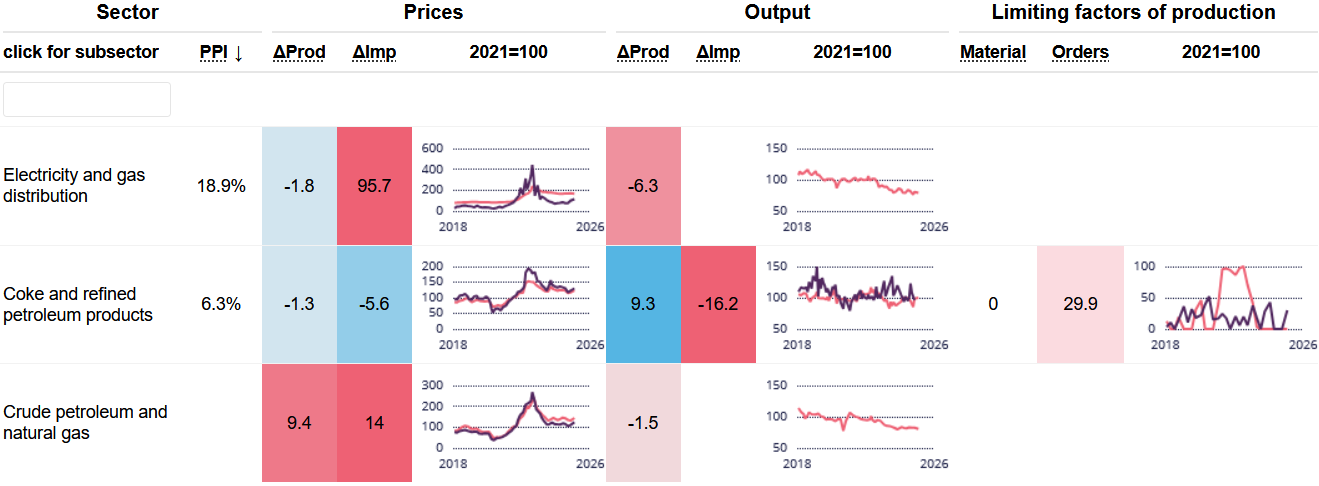
While price trends were relatively homogeneous in the energy sector, differences are evident on the volume side. The import volume of gas declined by more than 35 index points from spring 2021 to its lowest point at the end of 2022. Since 2023, it has remained stable at this lower level.
Figure 2
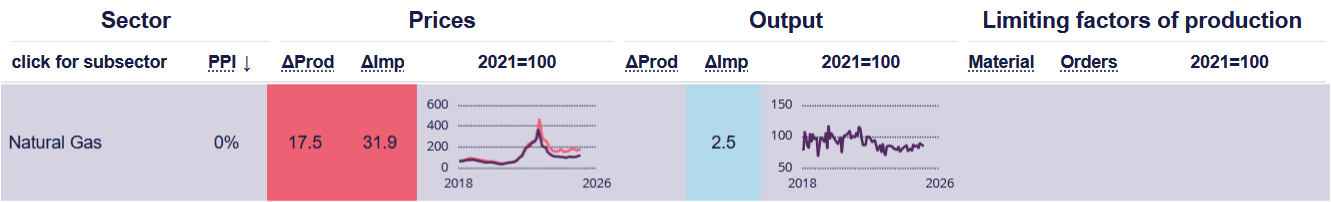
In contrast, electricity imports show an overall upward trend, reaching a record high at the end of 2024. National electricity production has shown a declining trend over the observed period, decreasing by approximately 20 index points.
Figure 3
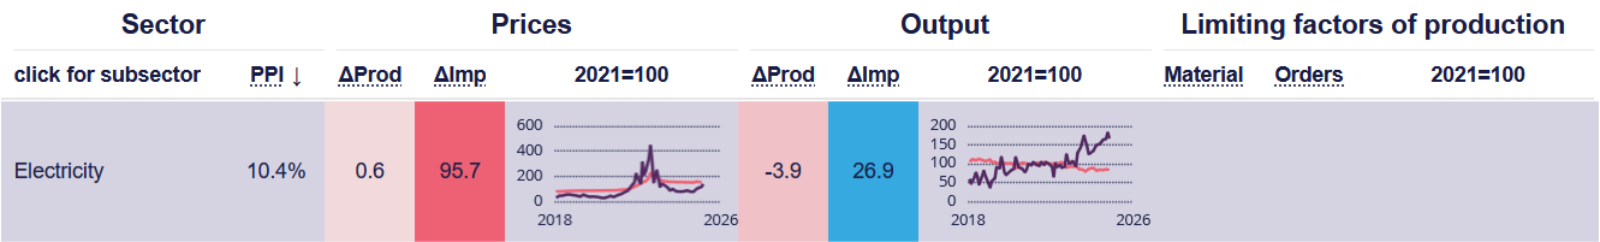
In some energy sectors, including crude oil and refined oil, domestic and imported production volumes hover around the index value of 100.
Food and Beverages: price increases in waves
Food prices hold significant importance, both regarding their weight in the producer price index and because of their visibility and impact on daily life. Over the year 2022, production and import prices in the food sector jumped by approximately a quarter. In 2023, they plateaued at this higher level.
Since the beginning of 2024, a renewed increase is visible, especially in import prices, with no signs of levelling off so far. At the same time, production and import volumes have remained largely stable throughout the observed period, indicating inelastic demand.
Figure 4
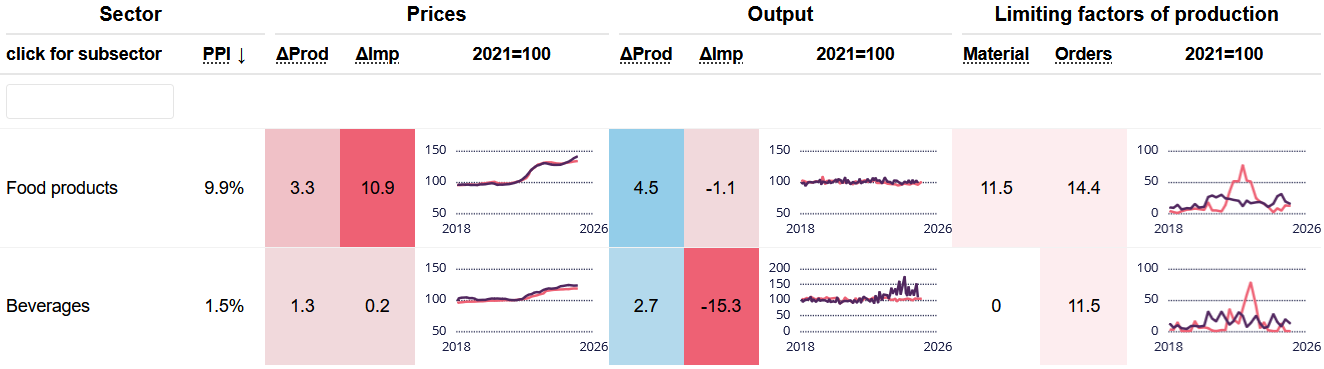
Prices in the production of beverages have shown a gradual and steady increase since at least mid-2021. The production and import volumes of beverages have remained at a similar level throughout the period, as with food. The fluctuations in beverage import volumes since April 2023 are most likely data errors (see Guide).
Our Supply Side Monitor does not yet include the agricultural sector, due to data incompatibility. Future coverage is planned; in the meantime, we rely on data from the food sector to monitor possible shocks in agriculture.
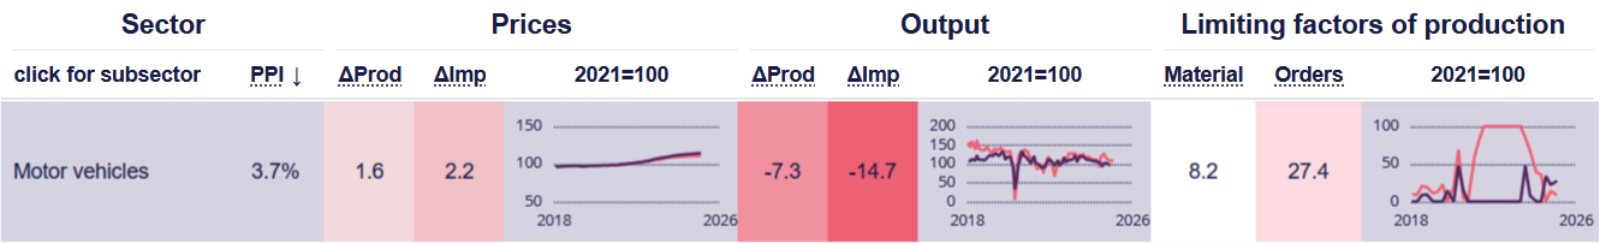
Automotive and Machinery: longer-term decline obscured by the COVID shock
The automotive and machinery industries account for approximately 15 percent of the producer price index’s total weight. Both sectors have shown continuous price increases from 2021 to 2024, leading to a new price plateau of about 15 percentage points above its 2018-2021 level. Domestic production prices and import prices have largely followed a similar trajectory.
Figure 5
Examining volumes, both domestic production and imports show a significant decline in 2020 due to the first wave of COVID-19. In the automotive sector, however, this negative spike obscures a longer-term decline starting in 2018: by end-2019, production had already declined by around 10 percentage points. After a post-COVID bounce-back, production and import volumes declined again and are now roughly a quarter below the levels of 2018.
In both the automotive and machinery sectors, the material shortages that emerged in 2020 became persistent from late 2021 onwards and only resolved during the course of 2023. Strikingly, all surveyed firms in motor vehicle manufacturing continuously reported material shortages from July 2021 until April 2023 (see the subsector ‘Motor vehicles’ in the Supply Side Monitor).
Figure 6
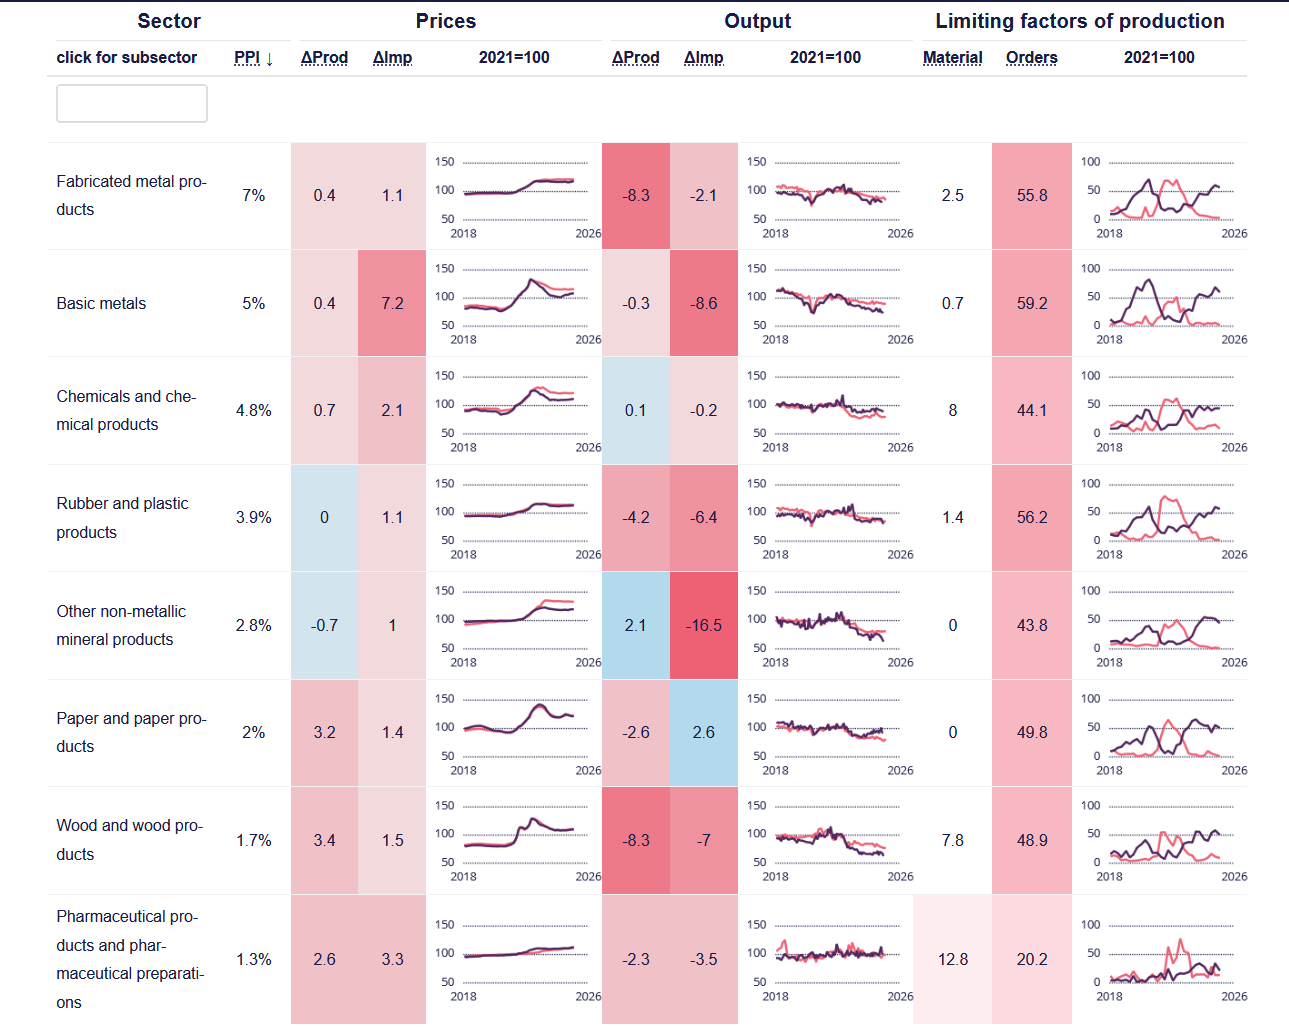
Materials: 2018 tariffs and a classic negative supply shock
In 2018, the US administration imposed tariffs on steel and aluminium in Europe, including Germany. Although countries tried to absorb the decline in exports to the US by finding new markets for their products, it is evident from the data that the basic metal manufacturing sector reported a severe lack of orders as a limiting factor for their production from 2018 onwards, with the first peak in October 2019.
The closely linked sector of fabricated metal products experienced similar limitations, but to a lesser extent. Despite a rising number of companies reporting a lack of orders, output and prices remained mostly constant until the end of 2019, when the pandemic took over.
Figure 7
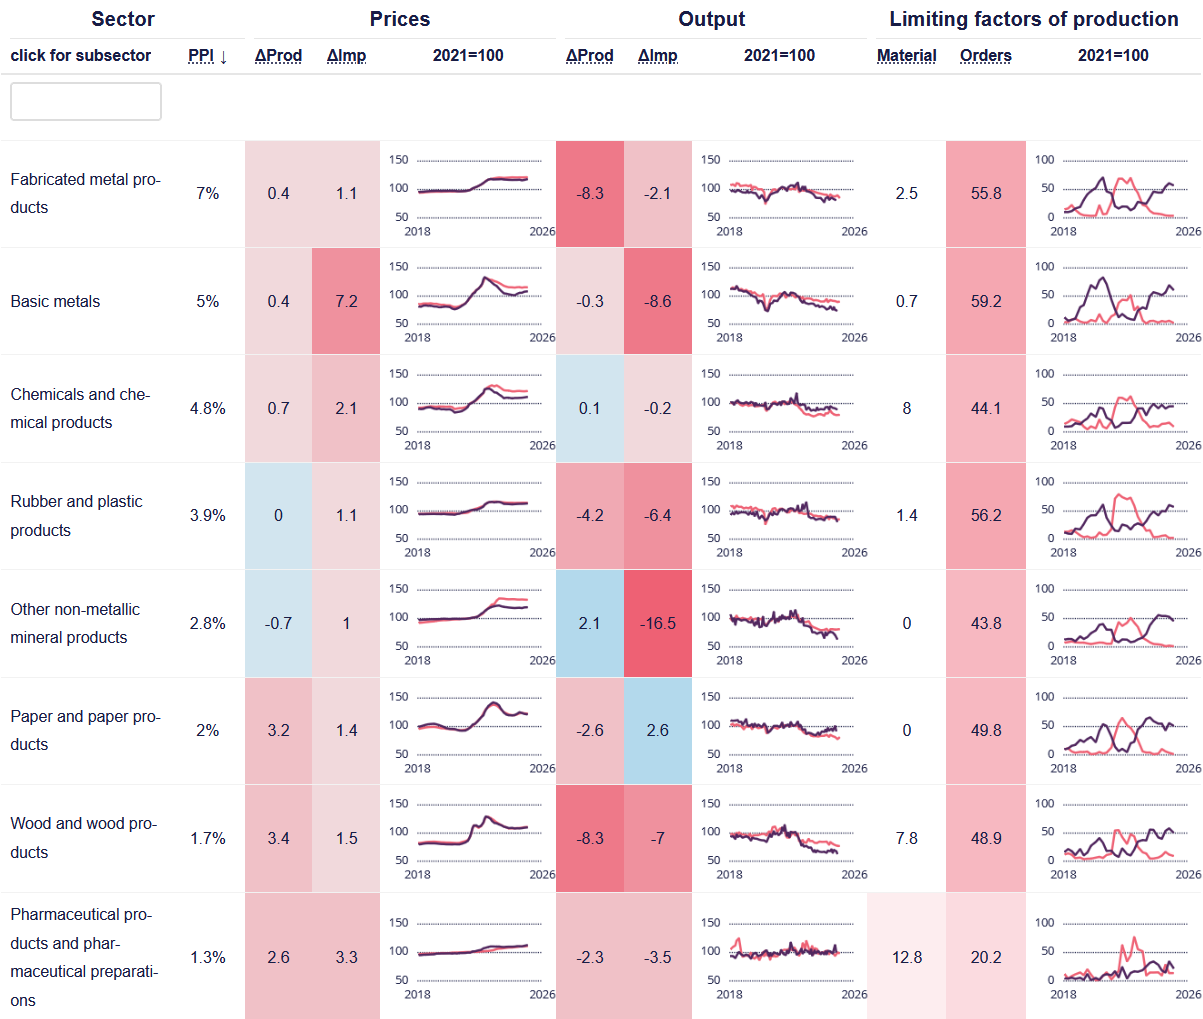
In the chemical- and basic metal production- and processing industries, a significant price spike occurred in mid-2022. Although this price spike subsided over time, prices remained at an overall higher level than before. In contrast, the production of fabricated metal, rubber and plastic products experienced a more gradual price increase to a permanently higher level, without a short-term, pronounced price spike.
Simultaneously, almost all material sectors, besides pharmaceutical production, show a trend of declining production volumes, likely in response to higher energy costs. The overall pattern in the materials sectors – higher prices, lower quantities – shows a classic negative supply shock.
Conclusions: Energy, a split pattern, and deindustrialisation
The monitor provides a disaggregated view of recent supply side developments in Germany. In our interpretation, the data supports three main conclusions.
First, it highlights the exceptional role of the energy sector, which has exhibited high volatility in prices and production volumes in recent years. The parallel movement of gas and electricity prices confirms the well-known merit order effect in electricity markets: Between 2021 and 2022, gas-fired power plants acted as the marginal producers, linking electricity- to gas prices.
Second, the observed price trends across non-energy sectors follow two distinct patterns. A first pattern is characterized by price spikes, where prices rise sharply, briefly regress, and then stabilize at a higher level. This pattern is observed in the energy, basic metals, chemicals, and paper and wood products sectors. A second pattern involves a steady price increase, with a gradual and continuous rise that eventually plateaus at an elevated level. This trend is evident in the automotive, machinery and electronics, fabricated metals, rubber and plastics, non-metallic minerals, and pharmaceutical products sectors.
This split pattern is likely due to sectoral differences including storage capacity, lead times for capacity adjustments, supply chain complexity, and contract structures. More research is needed to identify the precise causes.
Third, on the production side, the monitor provides clear evidence of an overall decline in industrial production in Germany. While the production decreases during COVID were short-term and primarily driven by supply chain disruptions, a more durable decline has set in since 2023, attributable to weak demand. Although a few sectors, notably refined petroleum, food and beverages, computers and electronics, and pharmaceuticals, have remained stable, these aaccount for less than 20 percent of the PPI. In contrast, significant production declines are observed in most non-energy sectors, accounting for over 40 percent of the PPI. Only specific sectors, such as segments of the electrical equipment industry—notably battery and accumulator production—as well as electronic components and circuit boards, have shown growth over the observed period.
Um über unsere weiteren Veröffentlichungen auf dem Laufenden zu bleiben, abonniert gerne unseren Newsletter.
Hat dir der Artikel gefallen?
Teile unsere Inhalte
