15. April 2025
/
/
Datensets
Guide to the Supply Side Monitor
7 min Lesezeit
Aurora Li, Leonard Mühlenweg
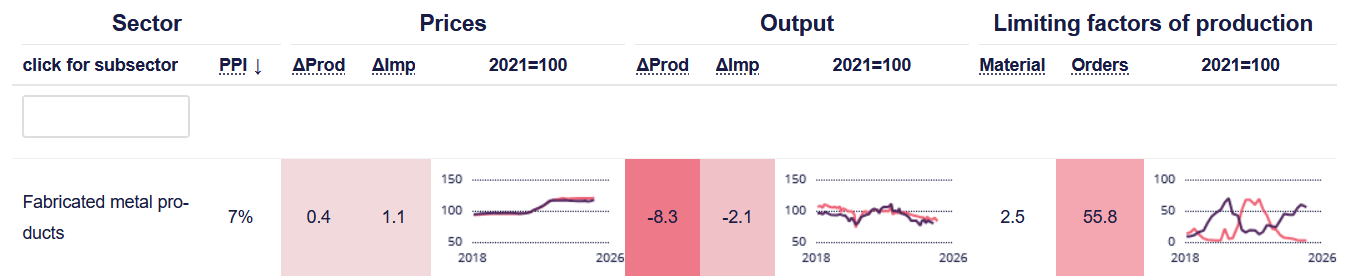
This is a guide to the Supply Side Monitor (SSM) by Dezernat Zukunft. In a first step the reader will be guided through how to read the SSM using the example of “Fabricated metal products” (graph below). Subsequently, the methodology, including data sources, data processing and the sector selection will be outlined.
How to Read the Monitor
The SSM is divided into four categories: 1) Energy, 2) Food, 3) Automotive, Machinery, and Electronics, and 4) Materials. Each category contains a group of sectors that correspond to the classification following NACE Rev. 2 classification, the European ‘statistical classification of economic activities’.[1] The sectors are presented at a 2-digit level. The sector names are simplified, but the official NACE names can be retrieved by hovering over them. Additionally, 3-digit subsectors are displayed by clicking on the main sector. The digit levels of the sectors refer to different levels of aggregation of economic activities.
Each category shows four sections: PPI weight, Prices, Output and Limiting Factors.
The Producer Price Index Weight (PPI Weight) represents the significance of the price changes of specific sectors, reflecting their share in domestic sales. For instance, price changes of “Fabricated metal products” account for 7 percent of the overall index. The sum of all weights equals 1.
The sections Prices and Output are structured as follows: the Change Rates in both sections show the percentage difference between the current month’s price level (or output level) and the three-month-moving-average from a year ago. For example, for February 2025 the change rate for Output compares the output level of February 2025 to the average output level of January, February, and March 2024.
Additionally, in the Prices section, the change rate of producer prices is subdivided into the change rate of domestic production prices and the change rate of import prices. For example, for February 2025 the domestic production prices in the sector “Fabricated metal products” were 0,4% higher than they were on average in the months of January, February, and March 2024. Meanwhile, import production prices in this sector were 0.3% lower than the average prices during the same months in 2024.
In the Output section, the change rate of production volumes is further subdivided into the change rate of domestic production and the change rate of imports.
The color scheme of the Change Rates works as follows: red represents overall supply side contractions due to increased prices or decreased volumes. Blue represents supply side expansions due to decreased prices or increased volumes. Stronger color shades stand for stronger expansionary/contractionary effects. The Limiting Factors are presented in shades from white to red, as they always indicate supply side limitations.
The Charts in the Prices and Output section show normalized levels relative to the base year 2021 for domestic and import.
The last section, Limiting Factors, displays the percentage of surveyed firms in each sector that have reported a ‘lack of material’ or a ‘lack of order’ in their production process. Firms can report multiple limiting factors.
Where does the data come from?
The main data sources are the German Federal Statistical Office (Statistisches Bundesamt) and the ifo Business Survey as further described below. The data is classified following the NACE Rev. 2 classification.
The Producer Price Index (PPI) for products (“Erzeugerpreisindex gewerblicher Produkte”) in the manufacturing industry is published at 2 and 3-digit level by the Federal Statistical Office.
The production index for manufacturing industries (“Produktionsindex für das Verarbeitende Gewerbe”) is published at 2 and 3-digit level by the Federal Statistical Office. The index is composed of the sectoral price-adjusted output based on value-added. In other words: Production is measured in monetary terms and then deflated to account for price effects. The production index is normalized to the year 2021, with a base value of 100.
The index of import prices (“Index der Einfuhrpreise”) is published at 2 and 3-digit level by the Federal Statistical Office. The index is normalized to the year 2021, with a base value of 100.
Import volumes (“Aus- und Einfuhr (Außenhandel)”) are published at 2 and 4-digit level by the Federal Statistical Office. We use import volume data (measured in tonnes) to create the import volume index (see below at ‘How was the Data processed’).
Weights for the producer price index are published by the Federal Statistical Office. The base year is 2021. The weights represent the significance of the price changes of goods for the overall index, reflecting overall domestic sales. The sum of all weights equals 1.
As for the Limiting Factors, the ifo Business Survey conducts firm surveys asking about the factors currently limiting their production. This data is reported at the 2- and 3-digit NACE level and is obtained from the data provider Macrobond.
Which industry sectors are shown in the monitor?
To filter by the significance of specific sectors, the monitor only includes 2-digit NACE industry sectors which have a producer price index weight of 1 percent or above. Sectors with a PPI weight below 1 percent are excluded. 3-digit NACE subsectors with a weight below 1 percent are kept in the monitor to allow for a disaggregated view within a sector.
However, specific exceptions were made with regard to the PPI minimum weight: Given the critical role of energy imports for the supply side overall, crude petroleum and natural gas were included regardless of their low domestic producer price index weights.
Additionally, sectors with substantial data gaps were filtered out. A final sense-check was conducted to ensure a consistent and meaningful selection of sectors.
How often will the monitor be updated?
The Supply Side Monitor will be updated on a monthly basis. Due to the time lag from the updated sources, the monitor will have a time lag of one month. Information on Limiting Factors will be updated on a quarterly basis due to their quarterly publication frequency.
How was the Data processed?
To enhance the informative value of the Supply Side Monitor, we processed the data in the following steps. Such include the calculation of change rates, the performance of seasonal adjustments on the production and price data as well as the construction of an import volume index.
Change rates are calculated by comparing the current month’s data (t0) to the rolling average of the three months of the previous year (t-11, t-12, t-13). For February 2025, for example, the output change rate compares the volume of February 2025 to the average volume of January, February, and March 2024. Rolling averages smooth out short-term fluctuations while still representing changes in the current month.
Seasonal adjustments were performed using X13 in RJDementra+.
The import volume index was constructed by the authors by aggregating the import volume (measured in tonnes) from all countries Germany imports from. Level 3 data is approximated by the PPI weights of level 4 data. The data was normalized to the year 2021, with a base value of 100.
Issues on data quality
During the setup of the monitor, several data outliers were identified in the data on imports, indicating potential data errors. These discrepancies have been reported to the Federal Statistical Office for review and, if necessary, correction. This process is still ongoing. The suspected errors apply to the import volume (measured in tonnes) for the following sectors:
- Manufacturing of Beverages GP19-02: Imports from the Netherlands in 04/2023, 08/2023, 10/2023, 01/2024, 04/2024, 07/2024, 10/2024
If Federal Statistical Office data entries are updated, this will be reflected in future updates of the monitor.
Since 2021, the data from the Federal Statistical Office on the import of natural gas (NACE 06.2) shows significant deviations from the data reported by the International Energy Agency. This discrepancy is assumed to be due to differences in the definitions used by both data sources. After conducting a comparative analysis of various gas-related datasets, we replaced the natural gas import data from the Federal Statistical Office with Eurostat’s data on gas supply in Germany.
Footnotes:
[1] The original data classifies the sectors according to the German Goods Classification (‘Güterverzeichnis für Produktionsstatistiken’), which corresponds to the NACE Rev. 2 classification.
Um über unsere weiteren Veröffentlichungen auf dem Laufenden zu bleiben, abonniert gerne unseren Newsletter.
Hat dir der Artikel gefallen?
Teile unsere Inhalte